Tables―Involving Others: A Magazine of the New Verse
Tables aren’t particularly fancy, but they offer a powerful way to present information. In fact, we can use tables to collect information about the MJP magazines that is currently unavailable through our search pages. One such function a table can perform is to list all the contributors to a journal; here’s a table that does just that for the 130 or so authors who contributed to the 26 issues of Others (another function of tables being that they can quickly calculate for us how many authors published in a magazine).
Table 1: an alphabetized list of Others authors, with the number of their contributions
The above table was derived from the MJP’s MODS files for Others (which are files that catalogue the individual items within each issue of the journal) by using an xsl stylesheet to extract a dataset of the journal’s authors, titles, and volume/issue numbers. We then imported that information into a spreadsheet, and created a pivot table in the spreadsheet that listed authors in the the vertical axis (in column A) and their titles as the table’s data (which resulted in the number count in column B). Then we uploaded the spreadsheet to Google Docs, from which the table above, like quite a few tables and graphs on this site, is now being served―though one could also have created the spreadsheet on the Google Docs site itself.
Table 2: Others authors, ranked by the number of their contributions
By sorting on the items in column B, we can easily re-present the above table’s data so it ranks the authors by the number of their contributions. We had difficulty doing that with the spreadsheets on Google Docs, however, so you’ll need to click on the Table 2 link below to see how this looks.
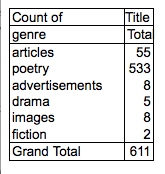
Table 3: All Genres in Others

By using another dataset that includes (besides author and title information) the genre we’ve assigned to each item in the magazine, we can also create tables like the following, which summarizes the genre-makeup of this poetry-heavy journal.
Table 4: Number of Items in Others, Sorted by Author and Genre
We can also flesh out those numbers by creating (from the same spreadsheet) another pivot table that shows how many items from each genre the authors contributed to the journal.
- Click here for Table 4
Table 5: Others Genre Spreadsheets
Here’s what the spreadsheet looks like, along with pivot tables for Tables 3 and 4 above (press the “Genre Numbers” and “Genre Numbers per Author” tabs to see these other tables).
Table 6: Hierarchical indented tree index of Others
Using Protovis software, we can also create more complicated tables. Here’s an indented tree index of Others that Jean Bauer, a digital librarian at Brown, created for us.
This table, drawn from a more extensive dataset than the ones used above, provides information about all the authors and titles in the magazine, as well as the approximate length of each item. The table moreover nests its contents, so the outermost tier on the left represents the journal as a whole; the second tier, the five volumes that make up the magazine; the third tier, the 26 issues in these volumes; the fourth tier, the authors who contributed to each issue; and the fifth tier, the titles of the texts those authors composed. This table is interactive, so you can collapse and open tabs at the journal, volume, issue, and author levels by clicking on any of the blue buttons. Hovering the cursor over any button will also open a gloss of the contents at that point.
Table 7: Comparison of two Datasets
Finally, to demonstrate some of the variables that can beset a dataset, we’ve developed a second set of tables about Others that calculate items in the magazine somewhat differently. Whereas the first dataset treats each part of a poem series as a separate item, the second set counts as an item only the poem series itself. (It’s debatable which way of counting is more accurate, given the variation in the kinds of poems published in the magazine.) The difference means that some authors in the second set of tables have been promoted in the overall ranking of contributions while others have slipped down the scale.
How We Made these Tables and Indexes
Coming soon . . .