Visualizing an Entire Journal: Others
On the Tables page, we’ve developed a fairly comprehensive graphic of the full run of Others: A Magazine of the New Verse that takes the form of an indented tree index of the magazine’s contents (Table 6). Using other visualization tools provided by Protovis, we can reconfigure that same information in a number of exciting ways. All of the Protovis graphics of Others that appear on the page below were created by Jean Bauer and Elli Mylonas at the Library’s Center for Digital Scholarship at Brown University.
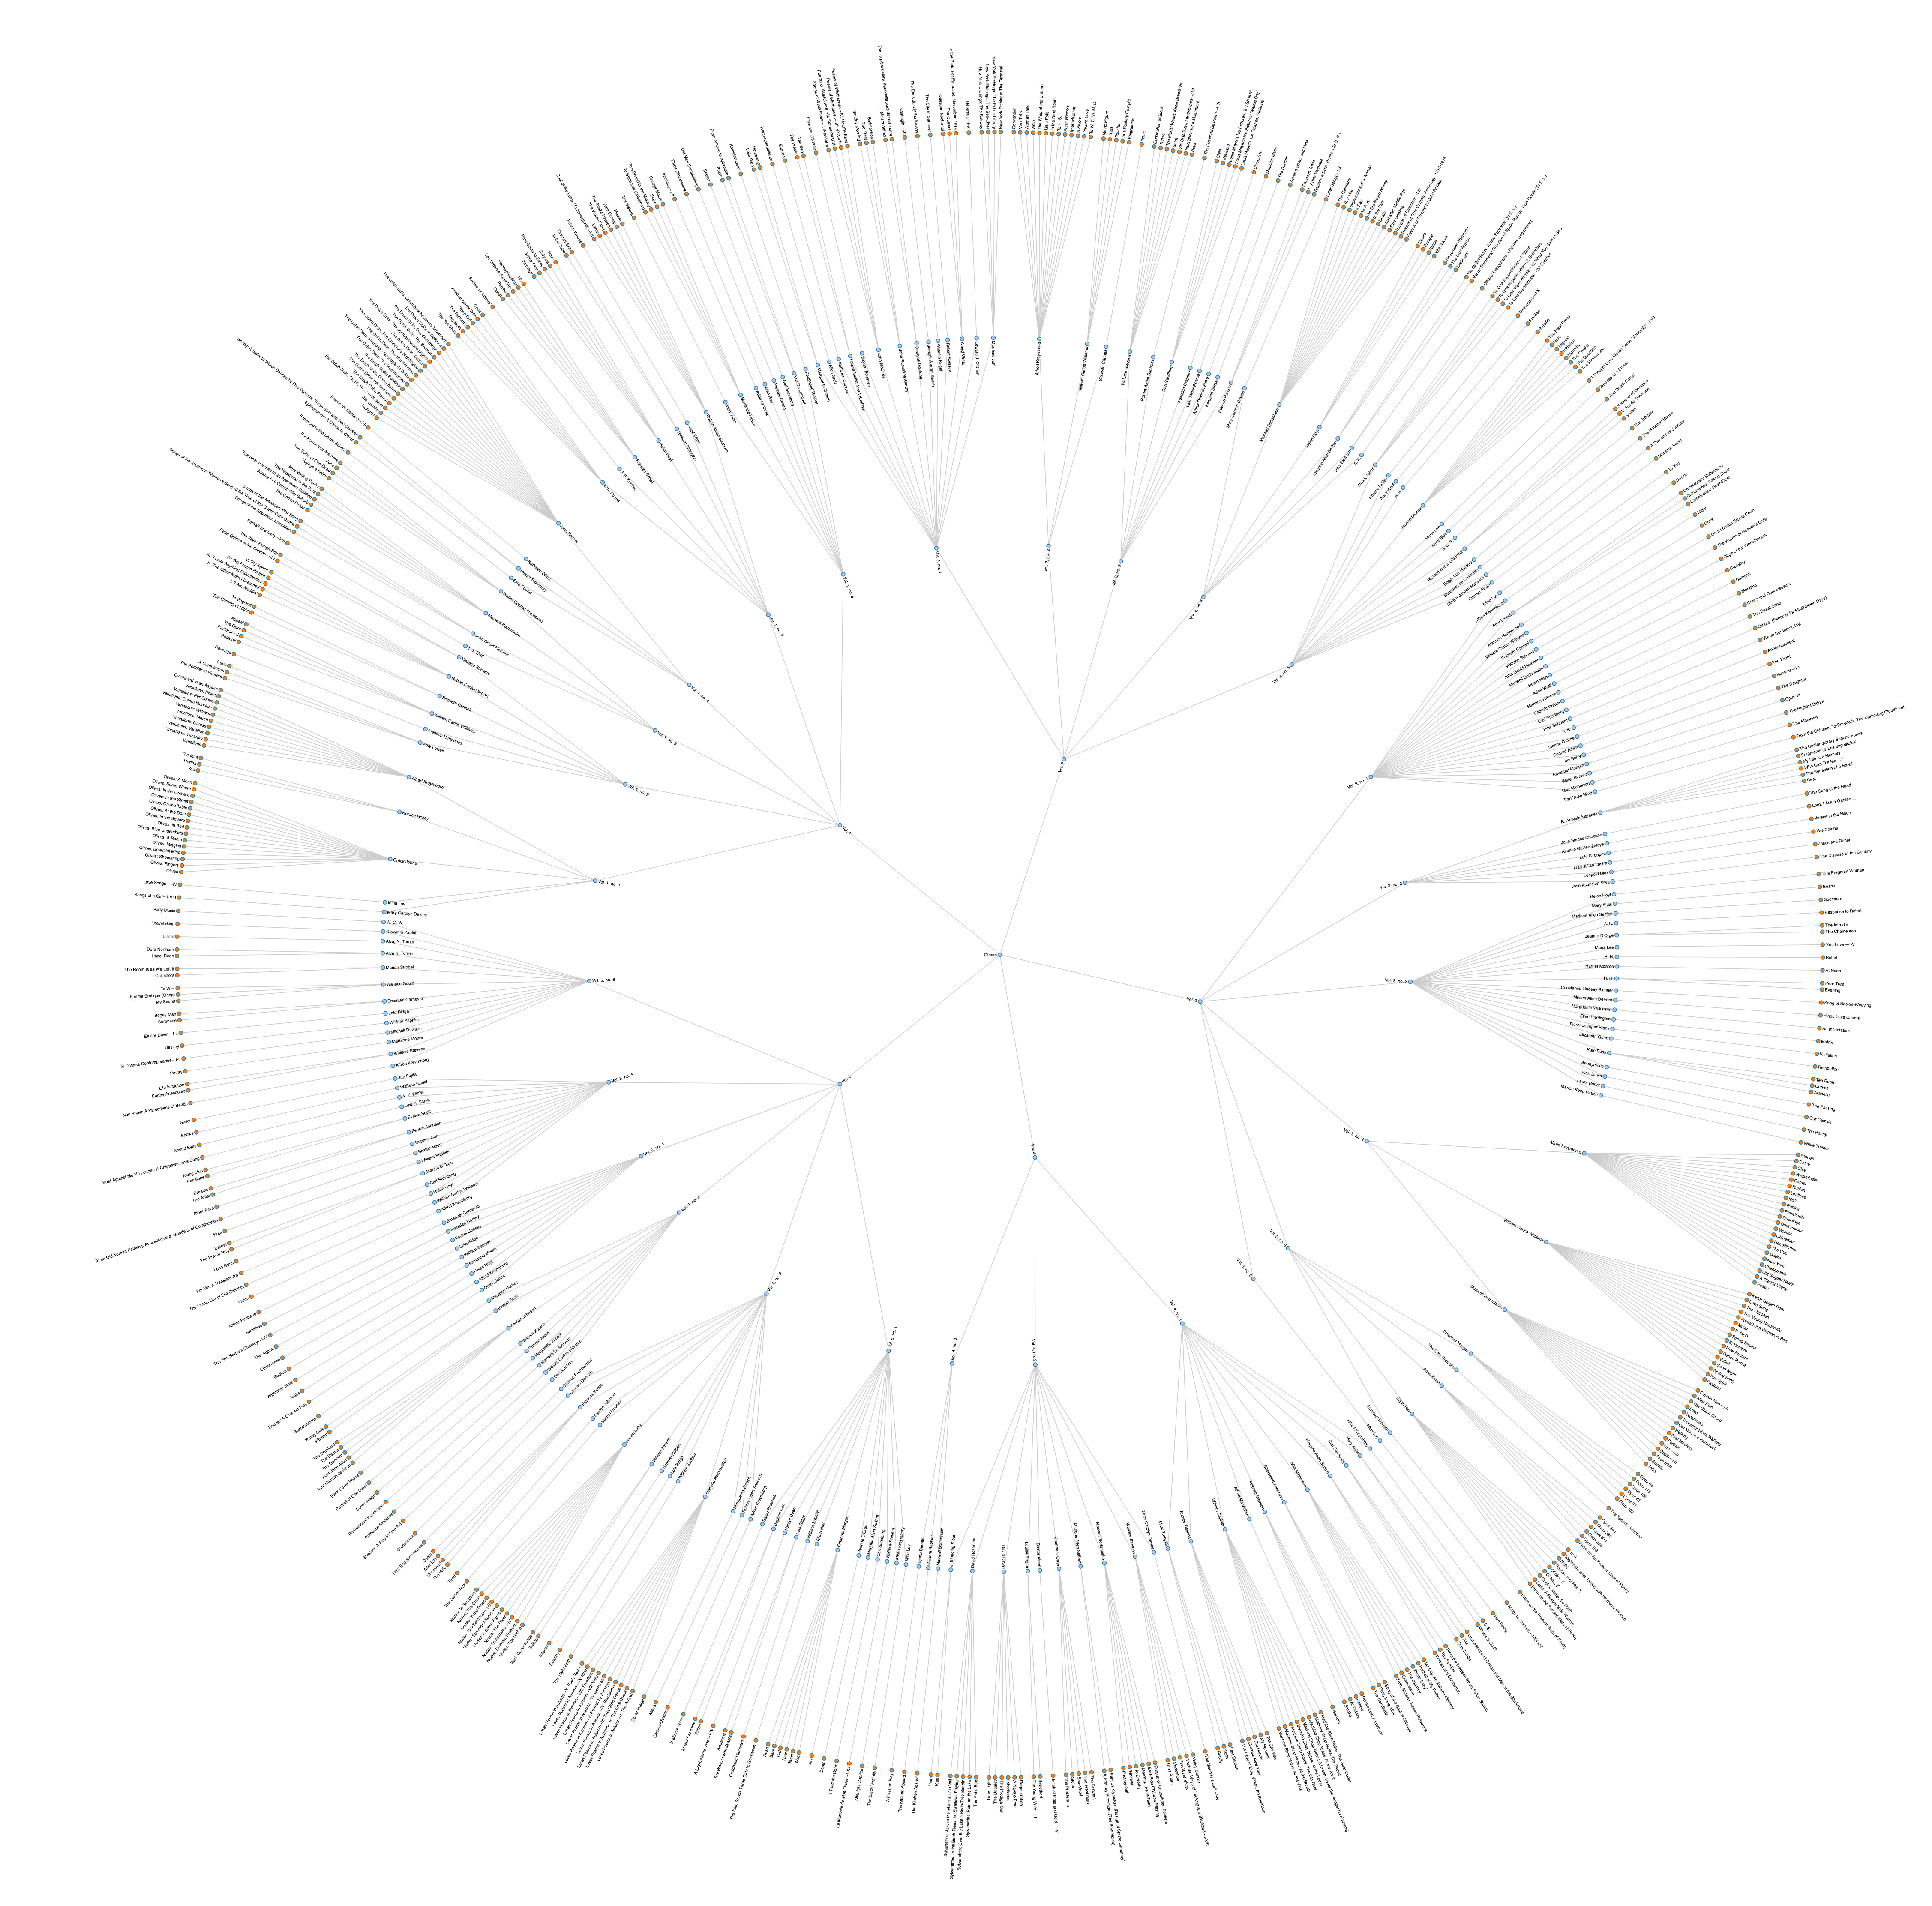
GRAPHIC 1: A NODETREE IMAGE OF OTHERS
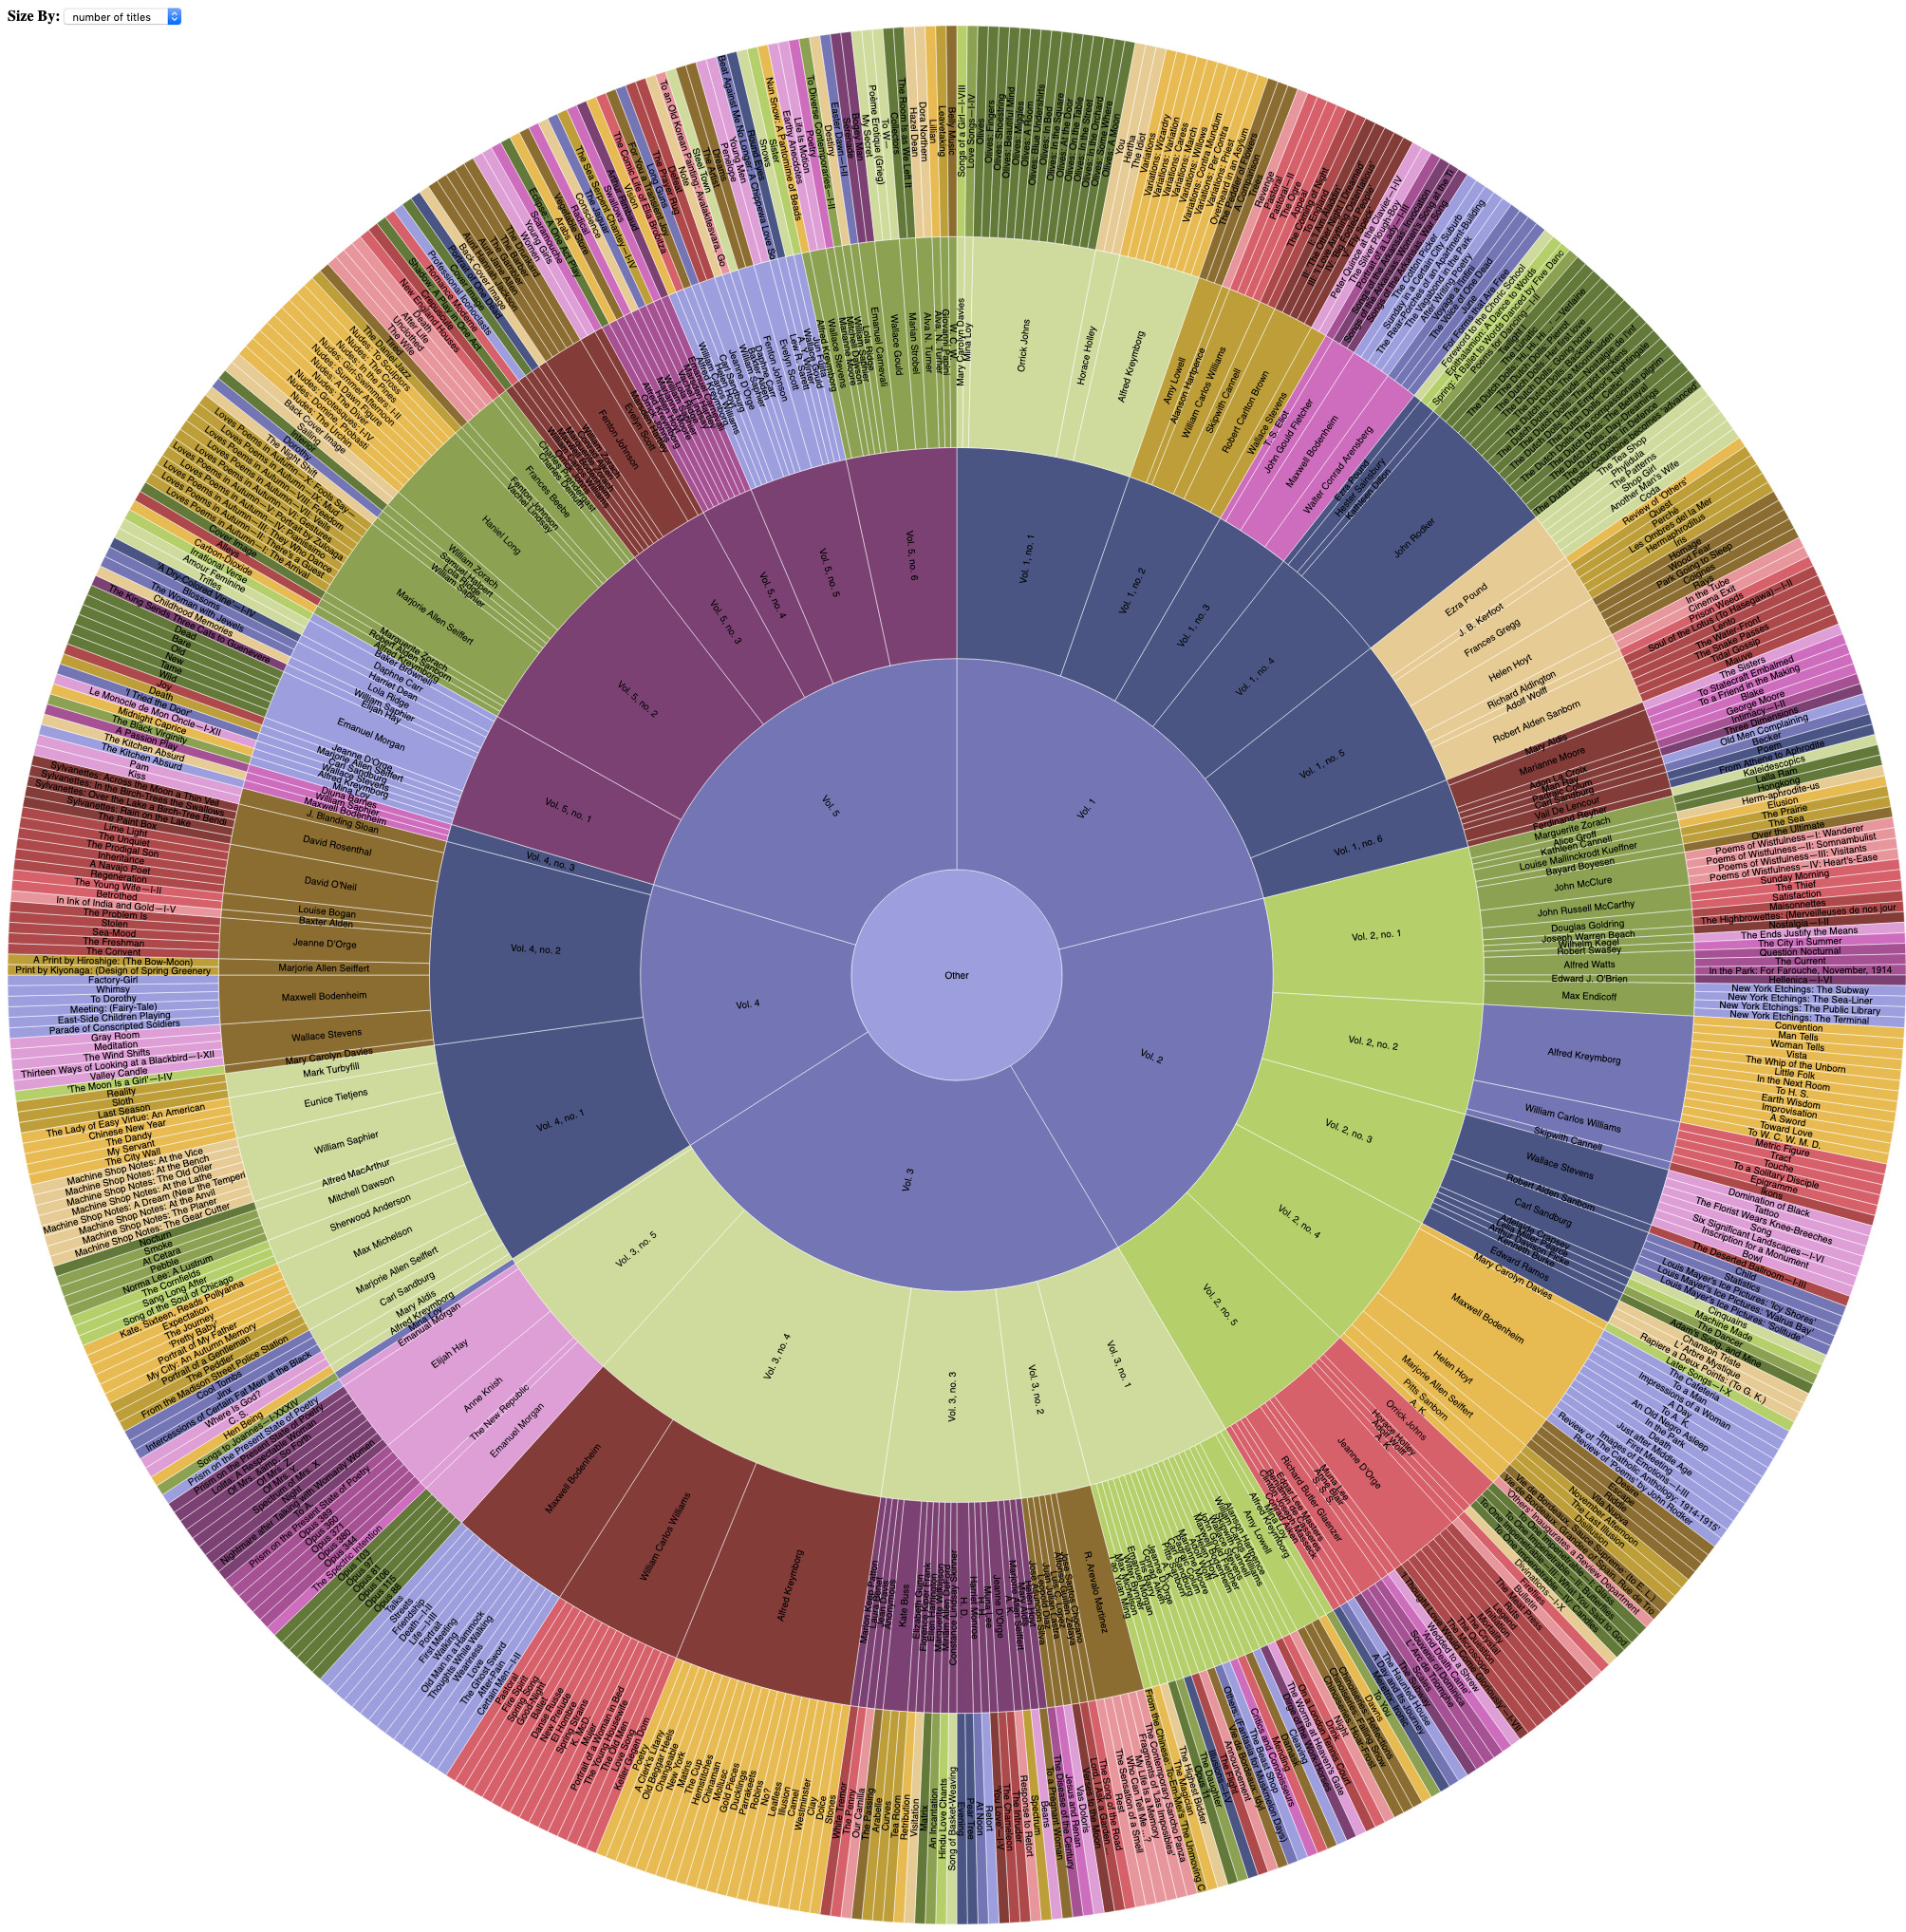
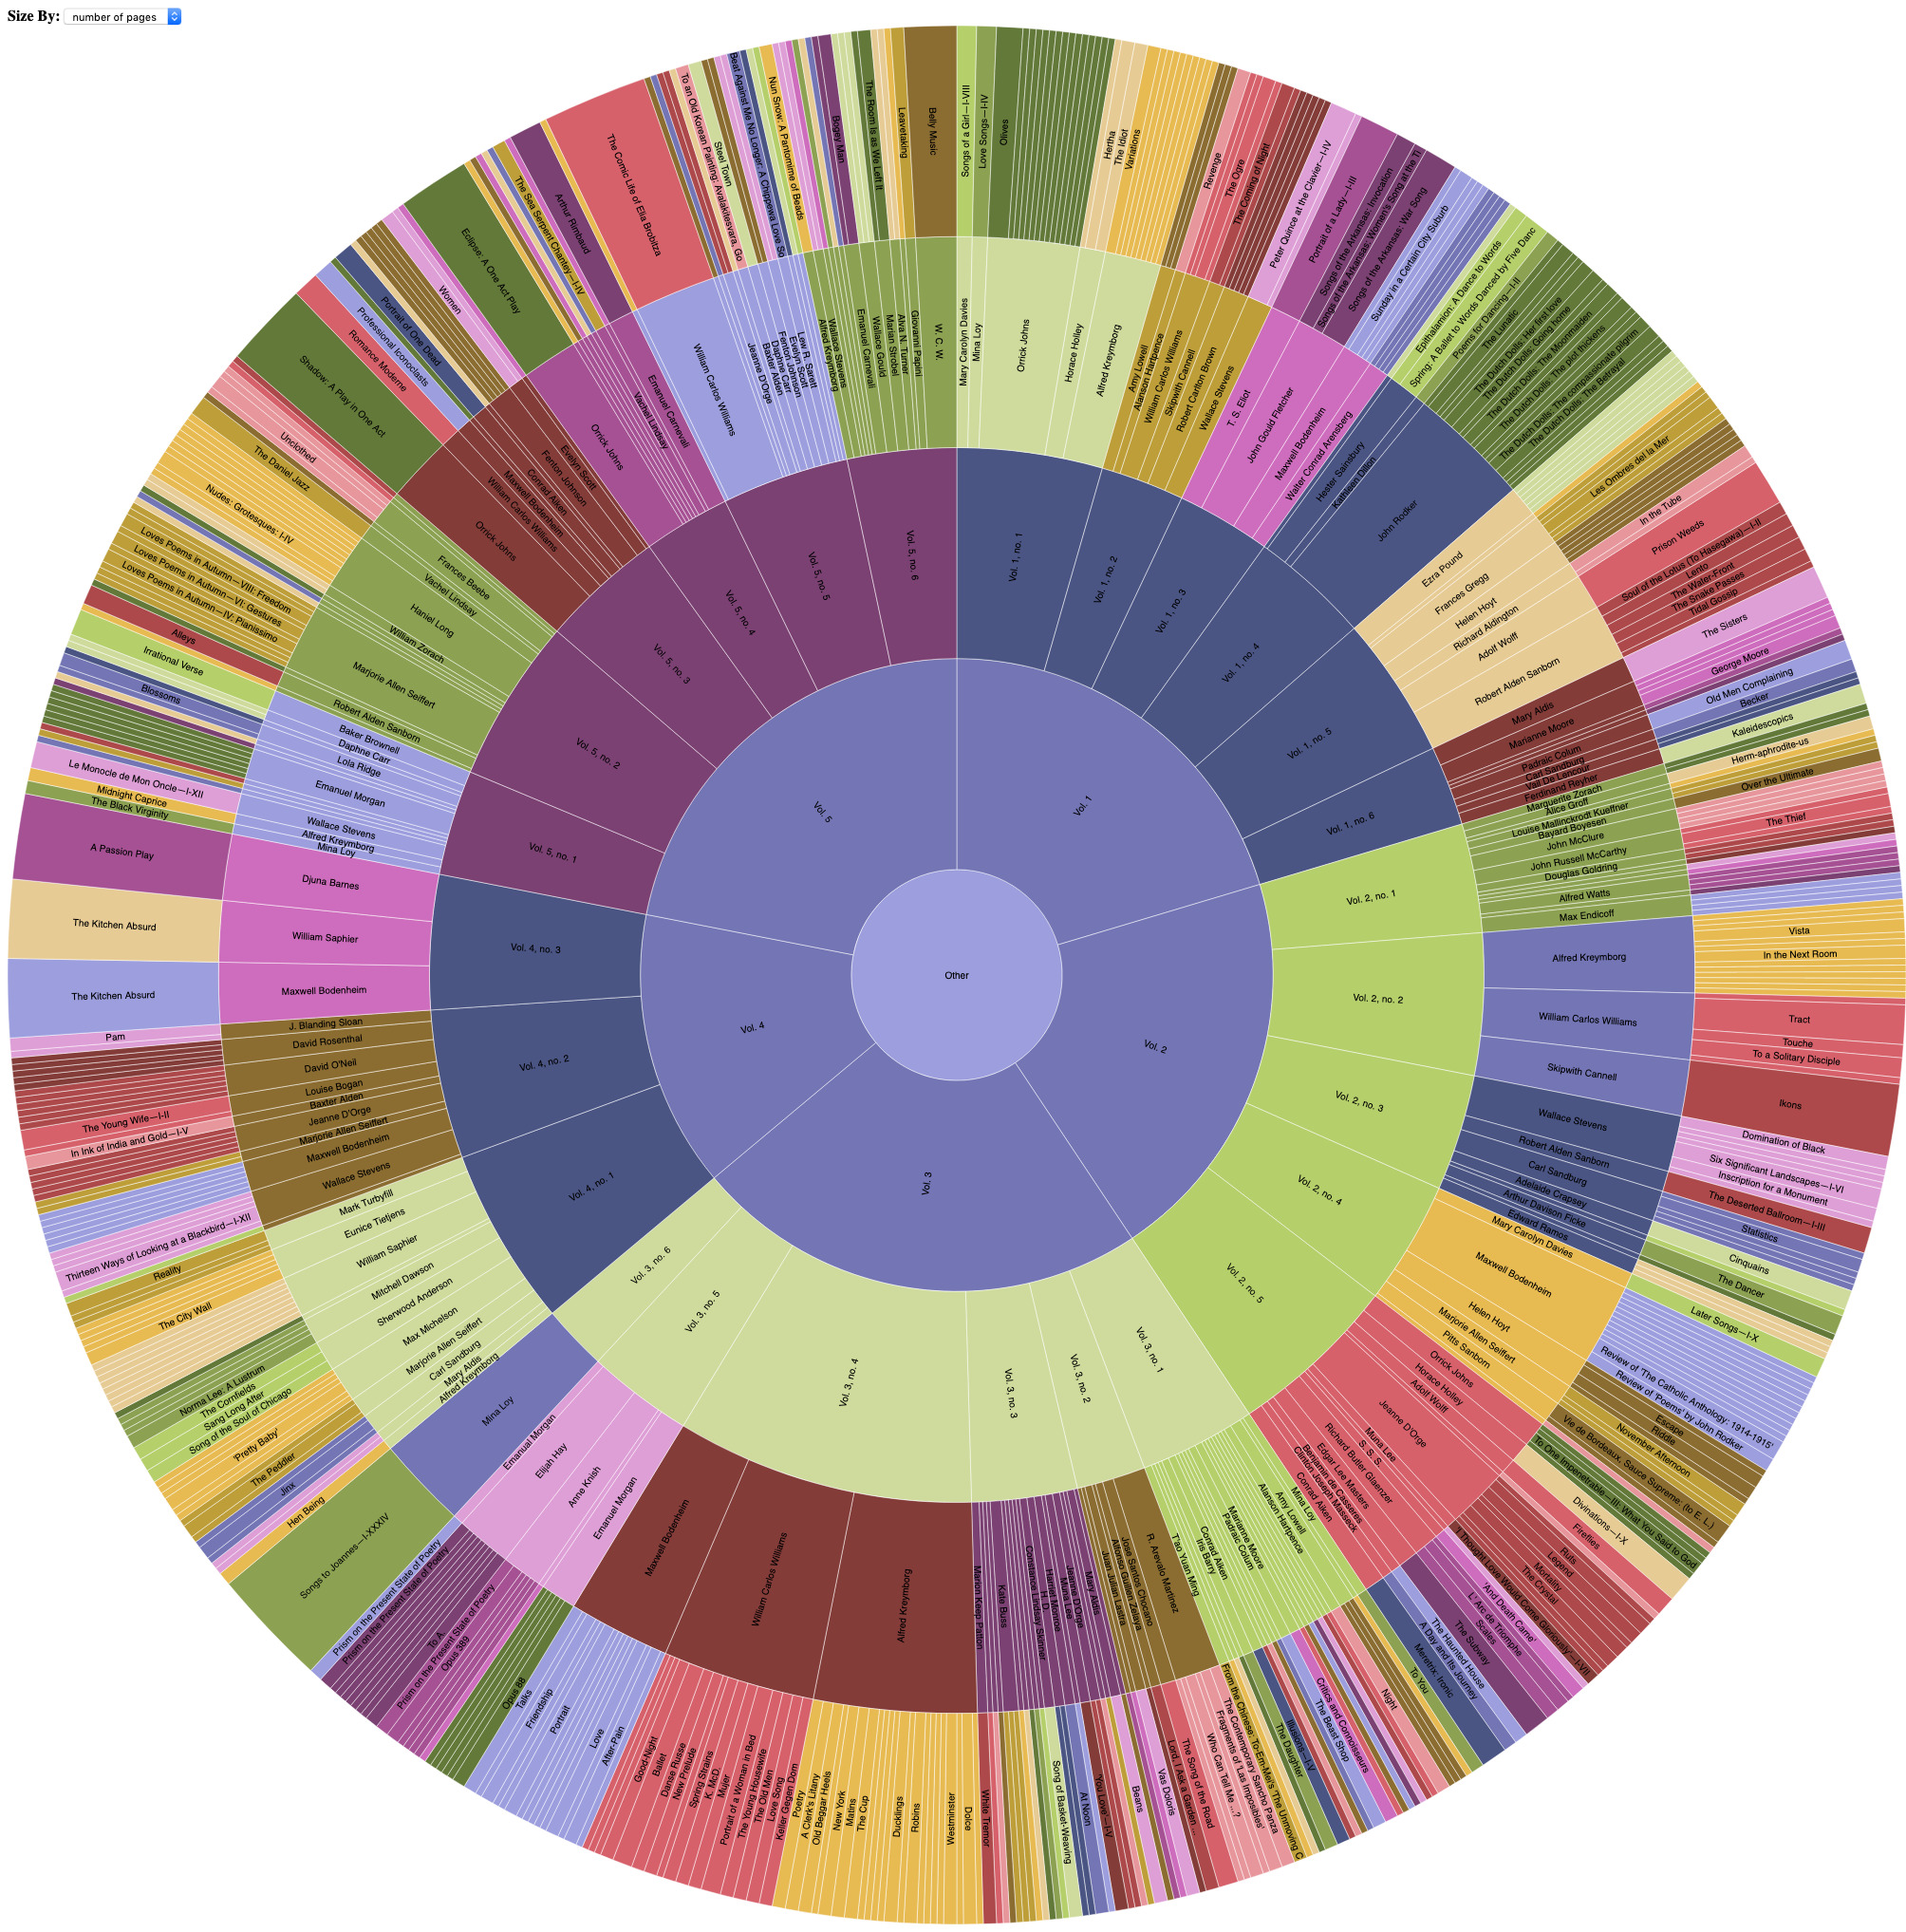
GRAPHIC 2: SUNBURST IMAGES OF OTHERS
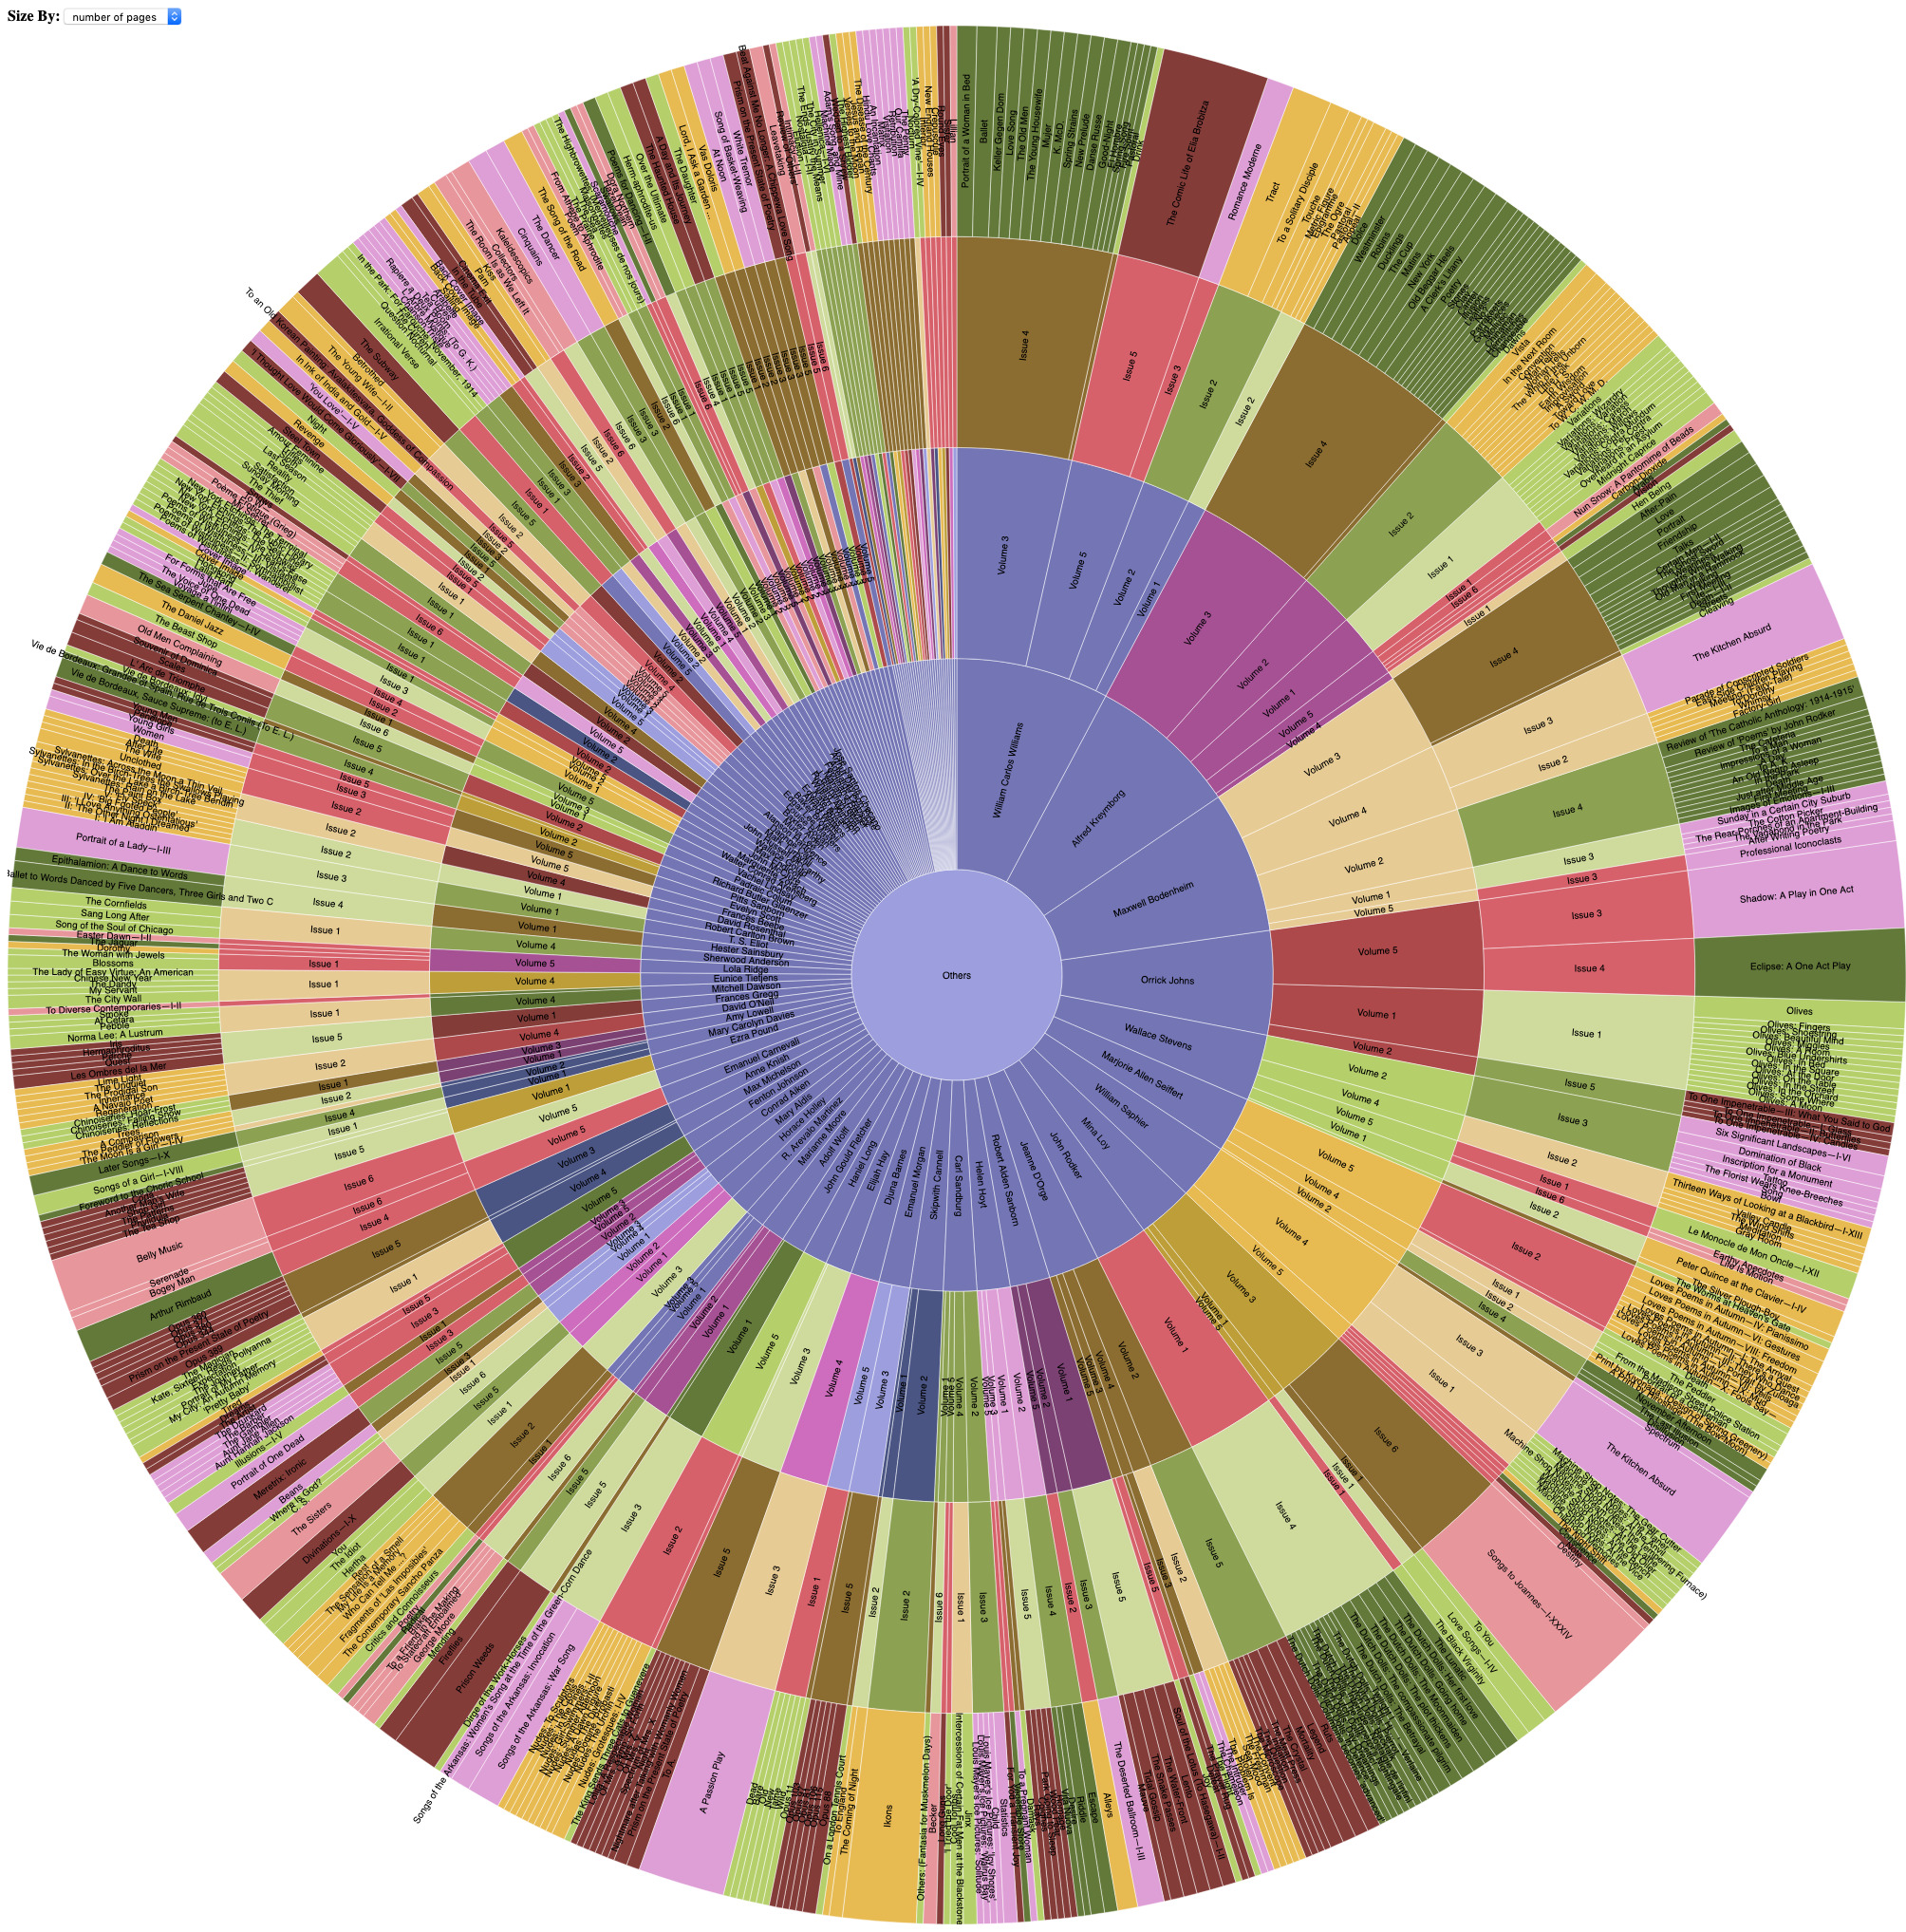
GRAPHIC 3: SUNBURST IMAGES OF OTHERS FEATURING ITS AUTHORS

Click on any of the above thumbnails or titles to see a very large version of that visualization. Built like a wheel, each visualization represents the full range of the magazine, starting with the magazine itself at the center (or hub) and then fanning out to represent different aspects of its contents.
In the first two visualizations, the expanding series of concentric circles represent (in this order) all five volumes of the journal, all 26 issues in those volumes, all authors who contributed to those issues, and finally the titles of all of the texts those authors contributed. The third image varies this sequence by placing the authors who published in the magazine at the innermost rung: so instead of seeing which authors published in which volumes/issues (as in the first two graphics), we see all of an author’s contributions grouped together and then which volumes/issues they appeared in.
The sunburst images (Graphics 2 and 3) also differ from the nodetree image by being interactive. Each of the sunburst visualizations includes information about the relative size (in pages) of each item, which is expressed by the relative size of the item in the image: thus in Graphic 2, we can immediately see that vol. 3, no. 4 of the magazine is the largest of the 26 issues. However, if you hold your cursor over any item in the graphic, a gloss will appear that gives you the exact name and size of that item―in the above case, “Vol. 3, no. 4: 82 pages.” This feature is especially useful for identifying the contents of the smaller items, where the labels have been cut short or entirely eliminated from view. You can see more labels by switching to a mangified version of the graphic, but you can also hover the cursor over any part of it to see what it represents.
Finally, the sunburst visualizations also allow you to view the graphic in two different ways: a “Size By” menu bar, in the corner of the webpage, allows you to toggle between “number of “pages” and “number of titles.” With the “number of pages” option, the graphic will represent (in the outermost circle) the relative page size of each text in the magazine, whereas the “number of titles” option treats each text as a single item, and thus represents it as being equal in size to every other text. Accordingly, when we view the graphic with the first “number of pages” option, Mina Loy’s “Songs to Joannes,” which occupies the entirety of issue 3.6, is easily seen to be the longest single text in the magazine, but when we select the second “number of titles” option, Loy’s text appears as just one item among many of the same size.
How We Made These Visualizations
Coming soon . . .