Visualisations
Introduction
|
A growing list of ideas for visualizing MJP data and metadata. |
Visualisation Projects
|
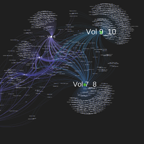
Wheel-shaped graphs that show authors' contributions to a run of magazine issues, weighted by page and title counts. |
|
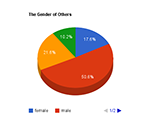
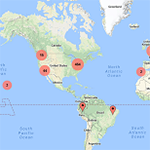
Automated detection and representation of contributorship gender in the magazines. |
|
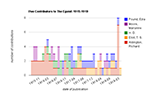
A set of charts comparing contributions to three little magazines that ran during World War I. |
|
Four sections of datasets, documentation, and visualizations to help you explore Chicago's role as a major node in modernism |
|
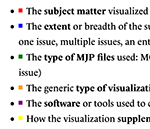
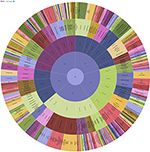
Visualizing the distribution of topics, contributors, genre, bibliographic features, and other elements. |
|
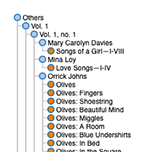
Simple yet powerful ways in which tables can visualize the content structure of a run of magazine issues. |
|
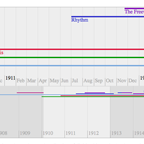
An interactive timeline of 26 (and counting) MJP magazines and anthologies. |